.avif)
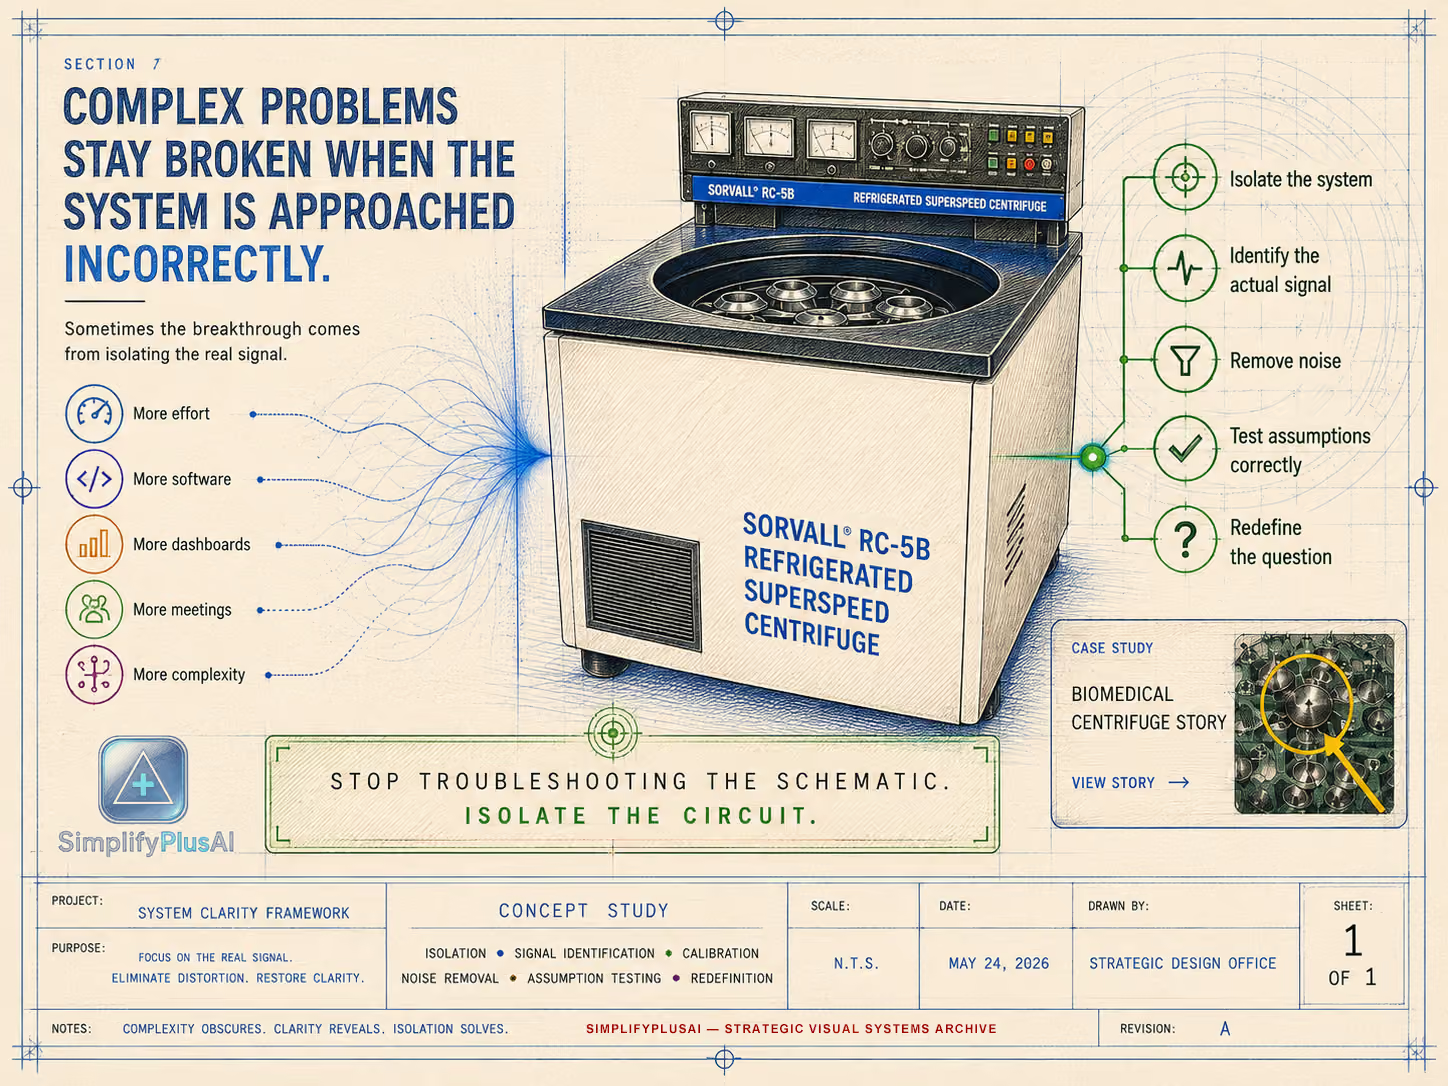
How system misalignment actually shows up inside organizations.
Most organizations do not fail because no one is working hard. They fail because the system is being interpreted at the wrong layer.
A performance issue may actually be a process-definition issue. A customer-service issue may actually be a policy-alignment issue. A decision-speed issue may actually be an authority-design issue. Once the problem is placed at the correct layer, the solution path becomes much clearer.
What These Examples Represent
These examples are diagnostic snapshots, not traditional client case studies unless explicitly labeled that way. They are simplified, anonymized patterns based on real organizational dynamics we repeatedly observe.
The purpose is not to tell a success story. The purpose is to show what changes when leadership stops reacting to symptoms and starts identifying where the system is producing conflicting interpretations of the same reality.
Manufacturing / Operations Example
Production inconsistency looked like underperformance by floor teams.
Teams were adjusting workarounds because process definitions differed between shifts.
Output variation correlated with handoff transitions, not individual effort
The organization was coaching performance when the real issue was process consistency across operational handoffs.
Service Organization Example
Customer complaints looked like inconsistent service-team performance.
Employees were operating under different policy interpretations across departments.
Escalations clustered around policy ambiguity, not execution failure.
The organization was measuring execution quality while the root cause lived in policy alignment.
Mid-Market Company Example
Slow decisions looked like a management-accountability problem.
Managers were waiting on conflicting inputs from multiple leadership channels.
Approval cycles expanded because authority paths overlapped.
The organization was treating a structural design issue as a people-performance issue.
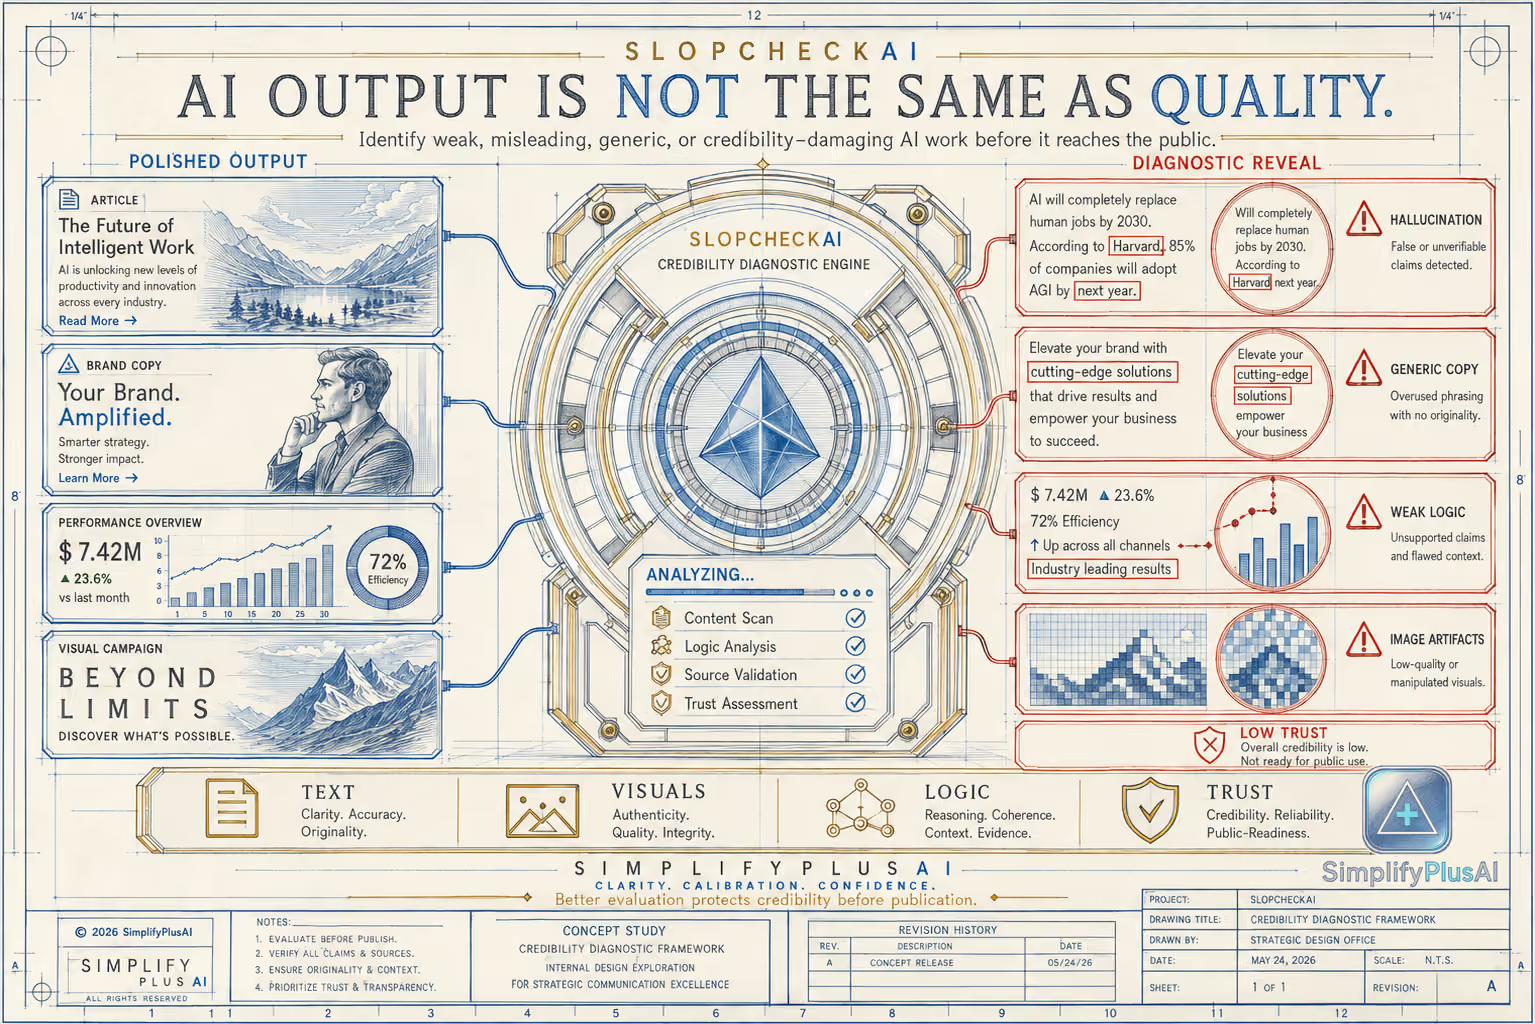
AI Output Diagnostic Example
AI output does not only fail when it is obviously wrong. It also fails when it looks acceptable but damages credibility, wastes resources, or creates confidence in weak work.
The output looked polished enough to send or publish.
Feedback was inconsistent and results did not match the real business need.
The issue was not the visible output alone; it was the evaluation system producing and approving it.
Iteration without evaluation creates more noise. Correct evaluation makes iteration useful.
WSS Workforce Stability System™
WSS is the clearest launch-ready proof lane for this page because it shows what system diagnosis looks like when applied to workforce stability. The point is not to add more data. The point is to reveal the truth hidden in the signal.
Absence Diagnostic Snapshot
AI output does not only fail when it is obviously wrong. It also fails when it looks acceptable but damages credibility, wastes resources, or creates confidence in weak work.
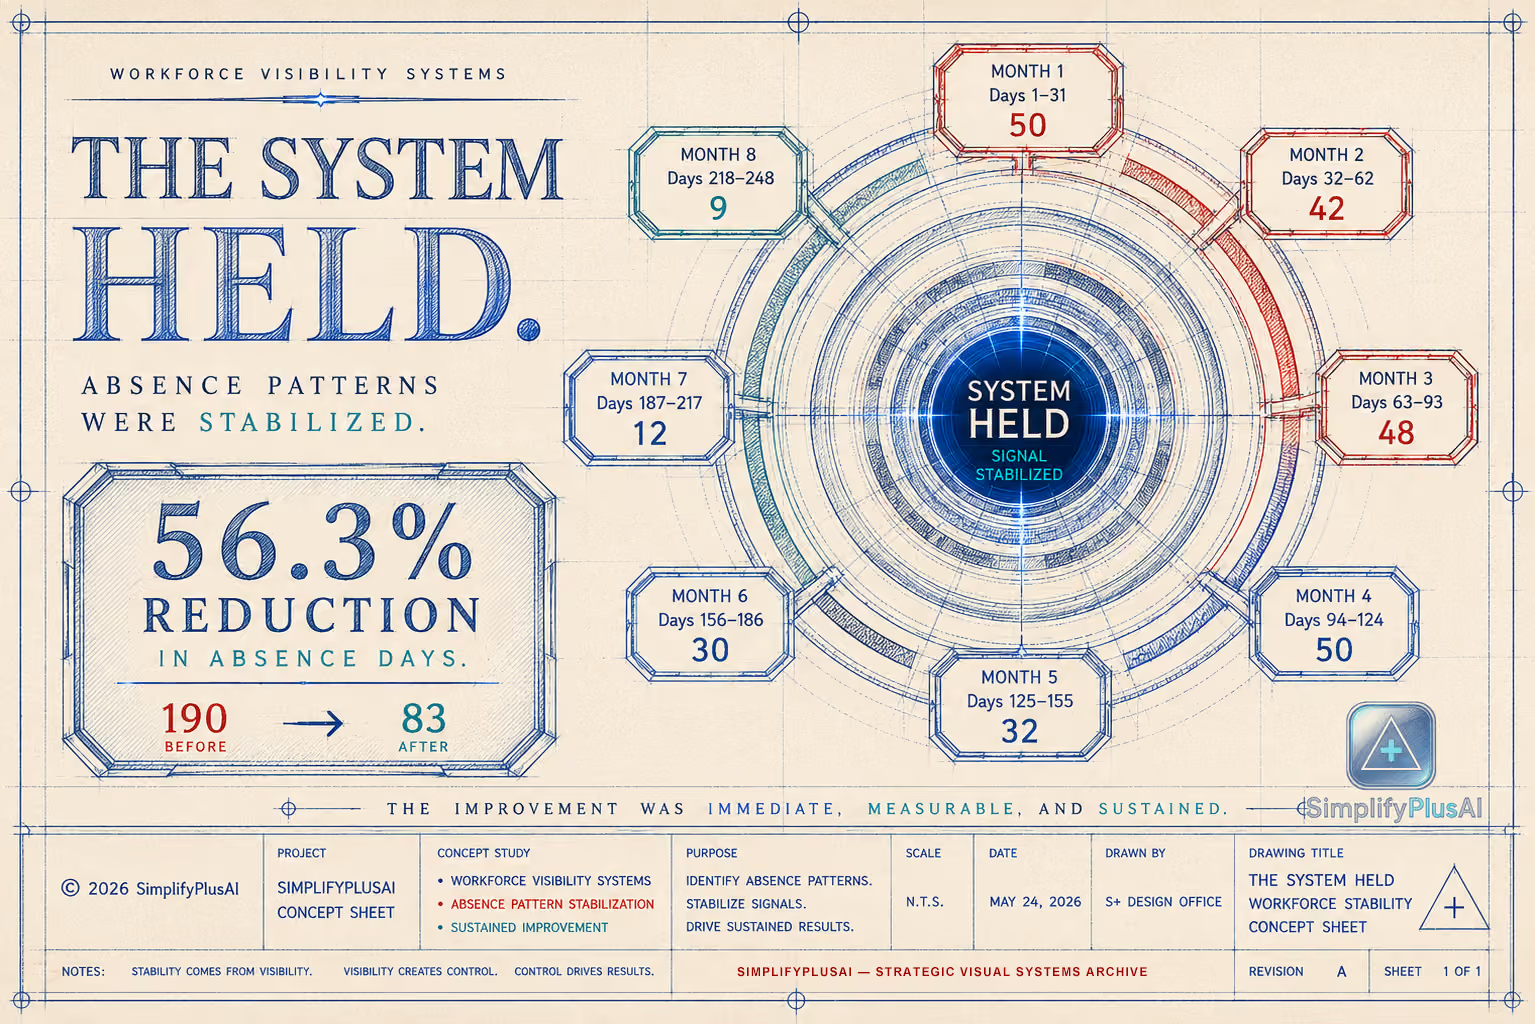
Absence looked like scattered individual attendance behavior.
Monthly absence totals showed a steep early instability pattern followed by sustained control.
The pattern shifted after visibility and accountability were introduced through a clearer operating system.
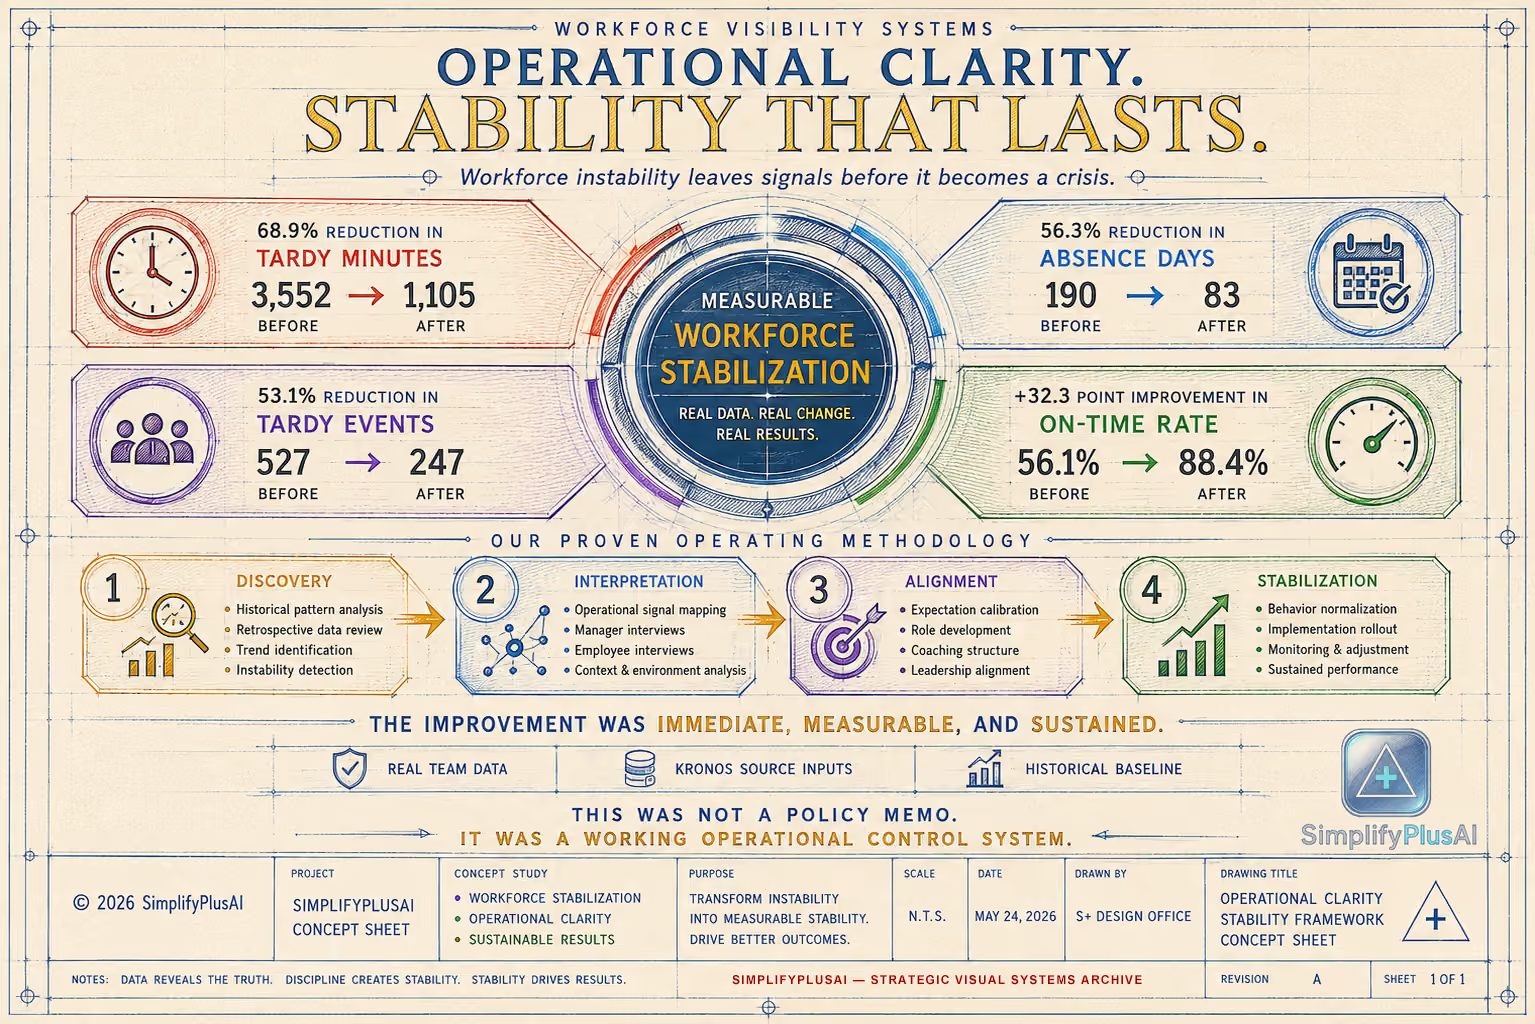
The system held: absence days were reduced 56.3%, from 190 before to 83 after.
Tardy Diagnostic Snapshot
AI output does not only fail when it is obviously wrong. It also fails when it looks acceptable but damages credibility, wastes resources, or creates confidence in weak work.
Tardiness looked like repeated employee-level behavior.
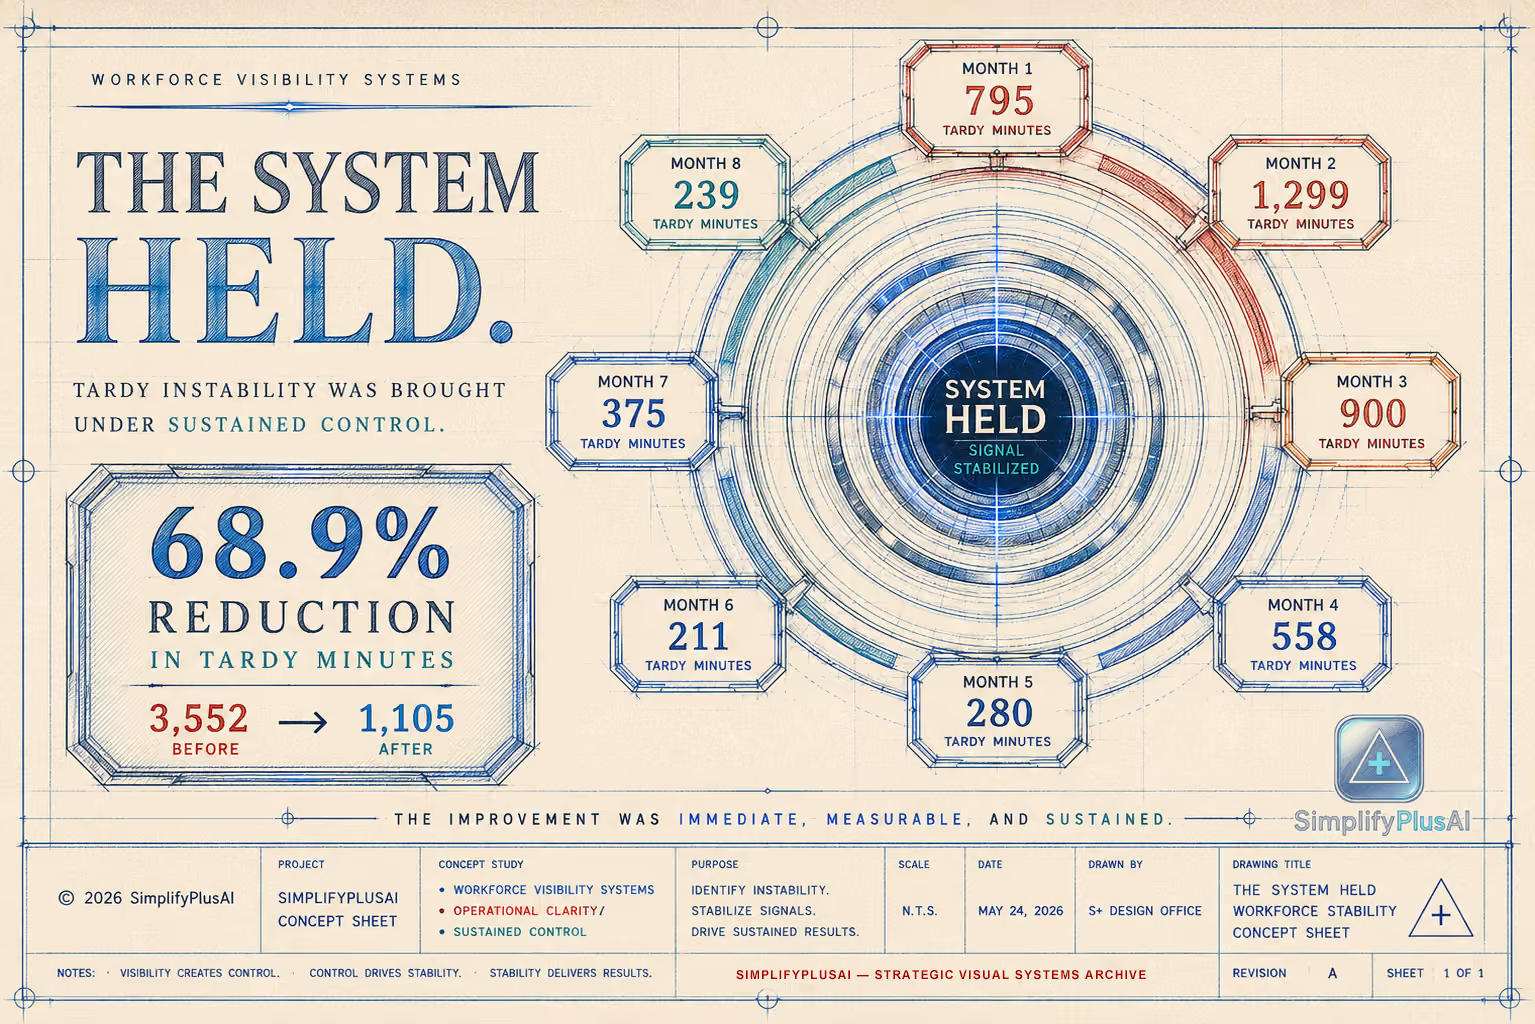
Tardy minutes showed high early instability and measurable decline after system visibility improved.
The operating issue was not only individual punctuality; it was the absence of a visible, trusted stability system.
The system held: tardy minutes were reduced 68.9%, from 3,552 before to 1,105 after.
WSS tardy case visual: 68.9% reduction in tardy minutes; 3,552 before to 1,105 after.
WSS timeline proof layer: the signal over time, before and after implementation.
What These Examples Have in Common
- The visible problem often appears at a different layer than the real cause.
- More dashboards do not fix an interpretation failure.
- Employee behavior, customer friction, and operational delay often trace back to system design.
- The correct diagnostic question is not “Who failed?” but “Where is the system producing the wrong interpretation?”
Why This Matters
Most organizations respond to symptoms because symptoms are easier to see. SimplifyPlusAI focuses on where the system is producing those symptoms.
That shift changes the conversation. Instead of asking for more reports, leaders can ask better questions. Instead of blaming the nearest visible problem, they can identify the structure creating repeated outcomes.
What This Is Not
That is intentional. Most organizations are already experiencing some version of these patterns. The difference is whether they are being seen at the correct layer.
If you recognize similar patterns in your organization, the next step is not more analysis. It is identifying where your system is producing conflicting interpretations of the same reality


.png)